# Logging and monitoring with Prometheus/Grafana/Loki
# Kubernetes Logging and monitoring with Prometheus, Grafana, and Loki for Appsealing Onprem Solution
# Introduction
Monitoring is a crucial aspect of any jobs for technologies like Kubernetes which is a rage right now, a robust monitoring setup can bolster your confidence to migrate production workloads from VMs to Containers.
There is an opensource monitoring solution. Prometheus and Grafana. This tool is a perfect combination for monitoring. Where Prometheus server is a metric storage or time-series database to store the metrics. Grafana is a visualization tool.
Loki is a horizontally scalable, highly available, multi-tenant log aggregation system inspired by Prometheus. It is designed to be very cost effective and easy to operate. It does not index the contents of the logs, but rather a set of labels for each log stream.
# Install the logging and monitoring stack.
helm repo add prometheus-community https://prometheus-community.github.io/helm-charts
touch values.yaml

prometheus:
  prometheusSpec:
    serviceMonitorSelectorNilUsesHelmValues: false
    serviceMonitorSelector: {}
    serviceMonitorNamespaceSelector: {}

grafana:
  sidecar:
    datasources:
      defaultDatasourceEnabled: true
  additionalDataSources:
    - name: Loki
      type: loki
      url: http://loki-loki-distributed-query-frontend.monitoring:3100
# What is this content based on?
Within the Prometheus stack operator Helm Chart (opens new window) is a values.yaml file. This file will tell Helm how to configure the Helm Chart upon installation. If we do not overwrite the value within the file, all the default values will get deployed. However, with the default values, we will not be able to connect Prometheus to our application. Thus, we are going to create our own values.yaml file and overwrite some of the values in the default one.
Helm provides a really handy flag to pass in a custom values file through ‘–values’. Note that we are going to install all of our monitoring resources into a monitoring namespace. You can create the namespace through the following command:
kubectl create ns monitoring
We can now run the following command to install the Helm Chart:
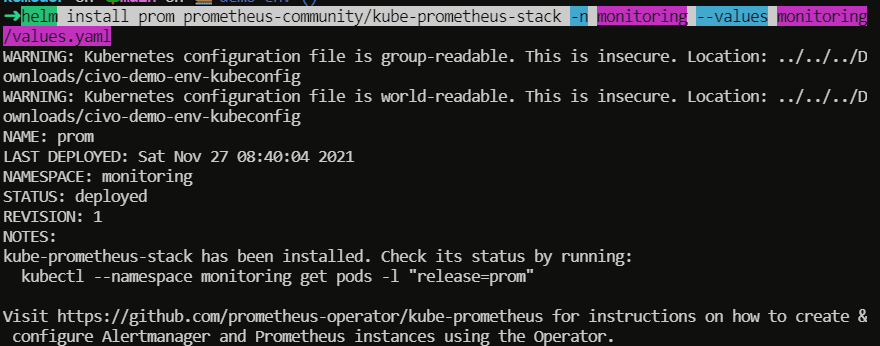
helm install prom prometheus-community/kube-prometheus-stack -n monitoring --values values.yaml
The Prometheus stack operator installation will be called ‘prom’ in this case. Feel free to name it whatever you want.
Note that I am running the command from within this git repository. Thus, the ‘values.yaml‘ file is hosted within a ‘monitoring‘ repository. Just make sure that you specify the right path to your values.yaml file.
The output in our terminal should look similar to the following screenshot:
Next, we want to deploy Loki within our cluster. Loki is responsible for gathering logs from our application. In short, Loki is responsible for gathering and managing logs.
First, add the Grafana Helm Charts to your Helm cli:
helm repo add grafana https://grafana.github.io/helm-charts
helm repo update
Next, we can deploy the Promtail and Loki in our cluster. Promtail will require a little bit of custom set-up. Thus, we are going to create a new values file that will host our Promtail configuration. Let’s call it promtail-values.yaml with the following specification:
touch promtail-values.yaml
---
config:
  clients:
    - url: "http://loki-loki-distributed-gateway/loki/api/v1/push"
---
Next, deploy loki and promtail:
helm upgrade --install loki grafana/loki-distributed -n monitoring --set service.type=LoadBalancer
helm upgrade --install promtail grafana/promtail -f promtail-values.yaml -n monitoring
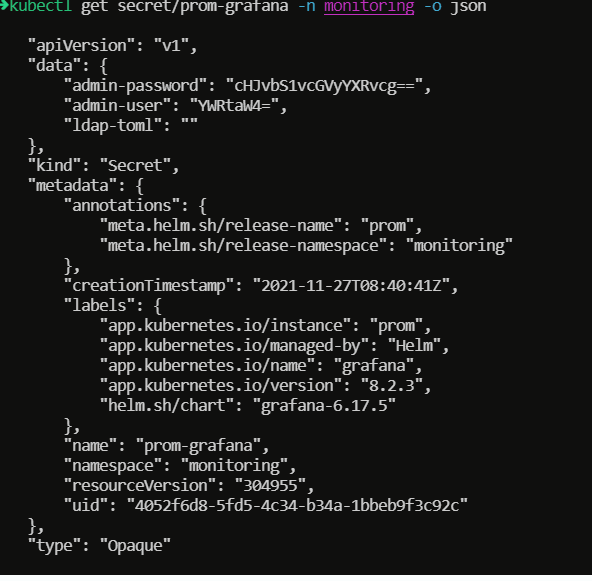
In most cases, you will need the log-in credentials for Grafana; by default, those are going to be:
Username: admin
Password: prom-operator
However, you can also look at the secret that got deployed through the Prometheus Operator Helm Chart:
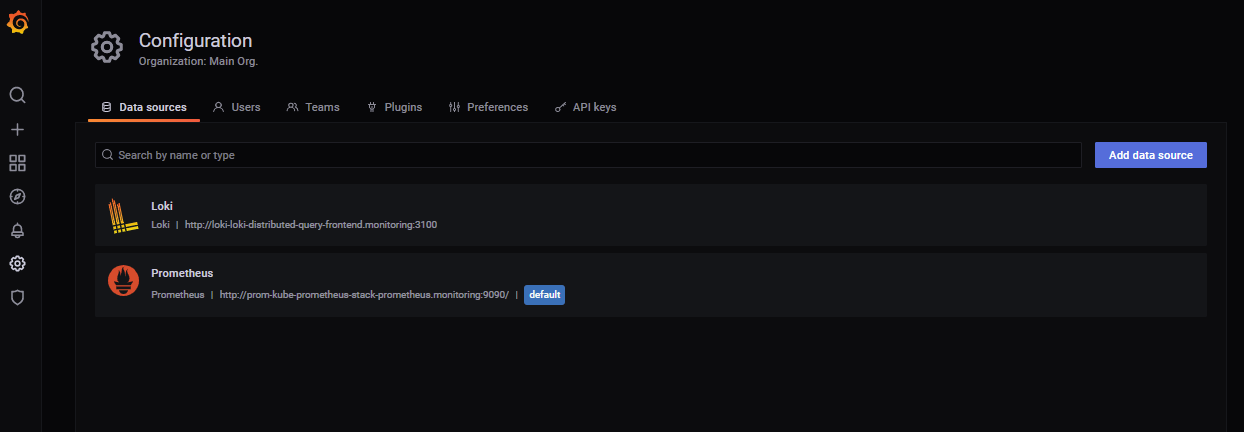
Once the resources are up in the cluster, and open the Grafana data-sources. You should see them added:
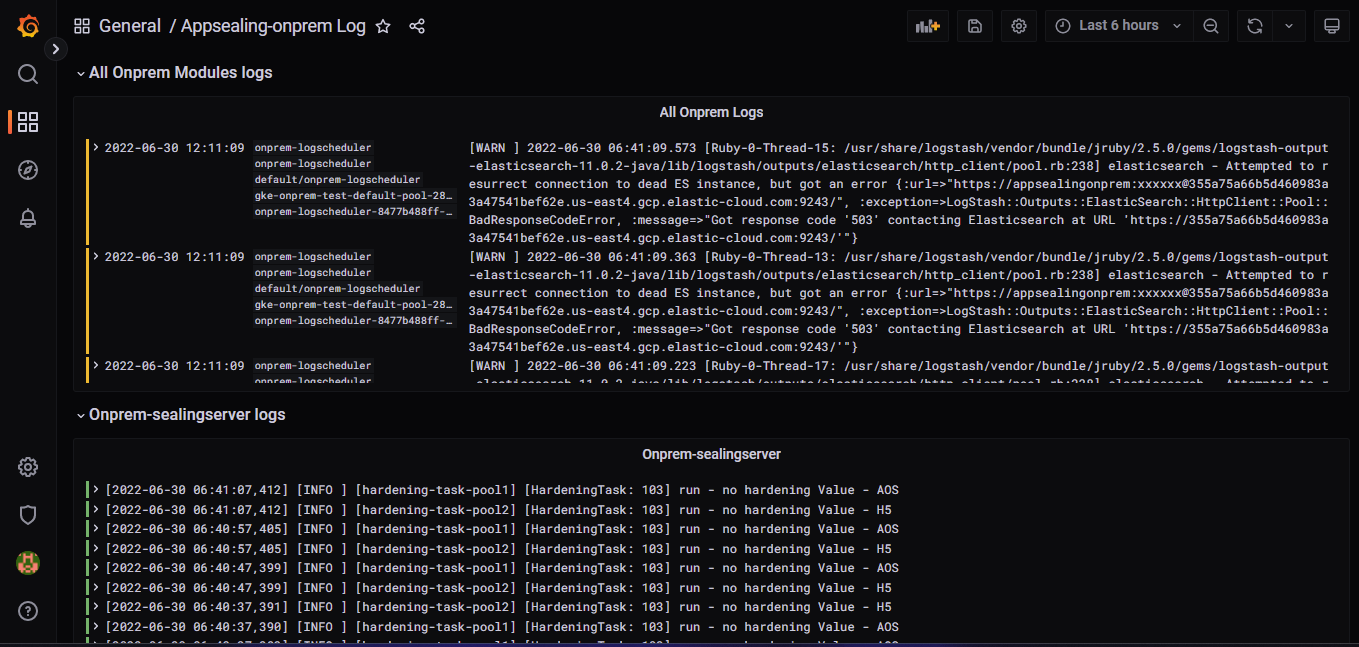
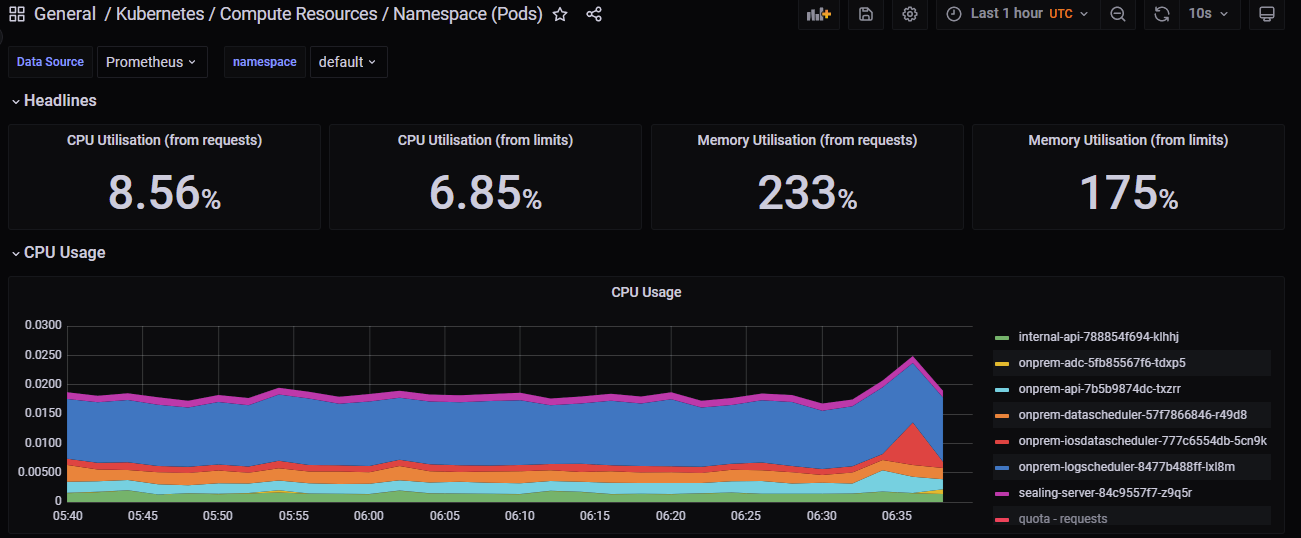
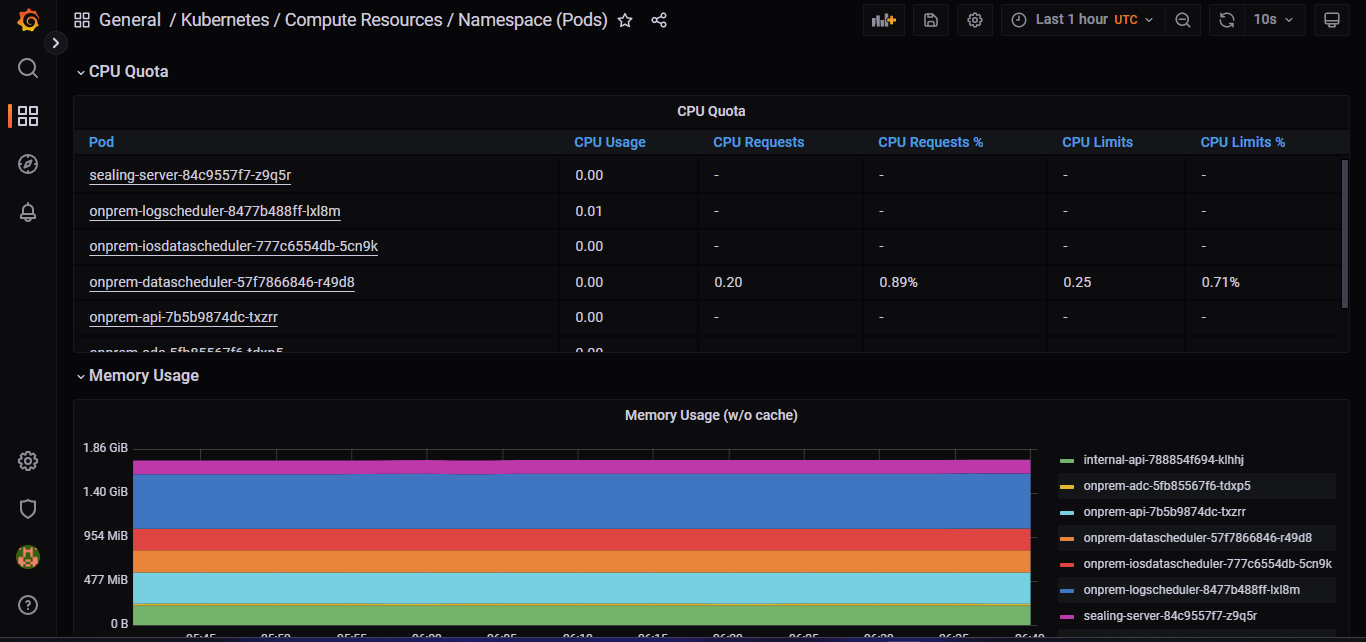
You can see the Dashboards for monitoring the Kubernetes resources.
Here, you need to configure the Loki dashboard for getting the logs of Kubernetes resources.
You can find some dashboards for loki or configure the same, please refer the doc Dashboards